Chủ động đẩy cảnh báo từ router về server (Telmetry MDT)
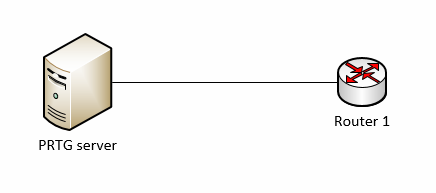
1. Sơ đồ mạng
Dùng Router chủ động đẩy dữ liệu về máy chủ giám sát theo chu kỳ, thay vì bị hỏi (poll) như SNMP truyền thống.
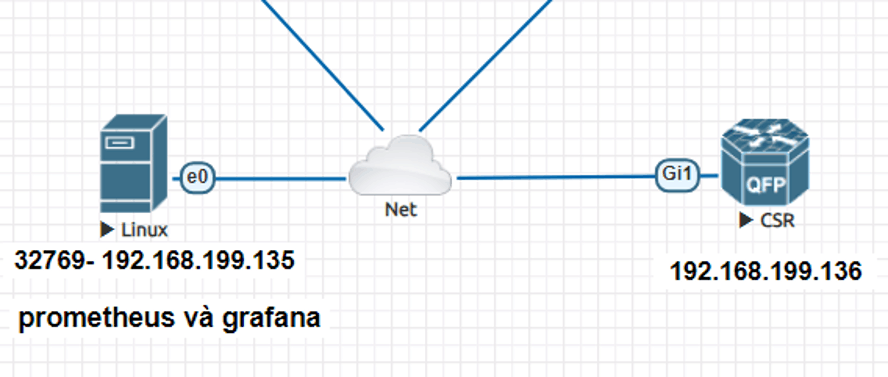
Router cần ping được đến máy chủ qua port 57000/TCP

2. CẤU HÌNH TRÊN ROUTER (Cisco IOS-XE)
Đầu tiên, đảm bảo Router có IP và bật NETCONF:
enable
configure terminal
interface GigabitEthernet1
ip address 192.168.199.136 255.255.255.0
no shutdown
exit
netconf-yang
2.1 Cấu hình Subscription giám sát trạng thái cổng
telemetry ietf subscription 105
encoding encode-kvgpb
filter xpath /interfaces-ios-xe-oper:interfaces/interface/oper-status
source-address 192.168.199.136 ##IP của router local
stream yang-push
update-policy periodic 1000 ##là 10s
receiver ip address 192.168.199.135 57000 protocol grpc-tcp
exit
Ngoài chế độ "periodic" (đẩy theo chu kỳ 10s như trên), Telemetry còn hỗ trợ chế độ "on-change" (đẩy dữ liệu NGAY LẬP TỨC khi có sự cố, không có độ trễ).
Tuy nhiên, trên môi trường lab ảo (CSR1000v), test thử thấy ko đổ dữ liệu về server, nên ta xài chế độ on-change .
Trên thiết bị thật ta nên ưu tiên dùng on-change thay cho periodic bằng cú pháp sau:
update-policy on-change
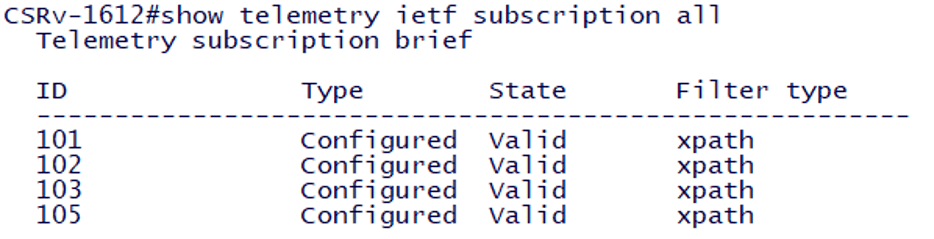
Show lại kiểm tra thấy valid là OK
CSRv-1612#show telemetry ietf subscription all
3. CẤU HÌNH MÁY CHỦ GIÁM SÁT
Ta bảo AI cho file config telegraf.conf để nhận dữ liệu telmetry từ router đẩy lên, tương tự như này
|
[agent] interval = "10s" flush_interval = "10s"
[[inputs.cisco_telemetry_mdt]] transport = "grpc" service_address = ":57000"
[[processors.enum]] [[processors.enum.mapping]] field = "oper_status" dest = "oper_status_code" [processors.enum.mapping.value_mappings] if-oper-state-ready = 1 if-oper-state-up = 1 if-oper-state-no-pass = 0 if-oper-state-down = 0
[[outputs.prometheus_client]] listen = ":9273" metric_version = 2 export_timestamp = true string_as_label = false ##Chỗ này để cảnh báo hiện ngay lên webgui khi có sự kiện như down/up, bảo AI lưu ý |
Đây là mẫu dữ liệu router đẩy lên, nếu xài tự code app hiển thị thì cho AI xem mấu này:
Cisco_IOS_XE_interfaces_oper:interfaces_interface_oper_status_code{name="GigabitEthernet2",source="CSRv"} 0 ## 0 nghĩa là down, 1 là up
4. CẤU HÌNH TỰ ĐỘNG TẠO GIAO DIỆN GRAFANA & CẢNH BÁO BẰNG SCRIPT
Copy đoạn dưới cho AI của bạn đọc; rồi bảo AI tạo giao diện theo nhu cầu giám sát (ví dụ bảng router, bảng event up/down) , nó sẽ sinh ra file ví dụ bên dưới:
|
import urllib.request, json, base64 grafana_url = 'http://localhost:3000' print("[*] 1. Dang tao Prometheus Data Source...") req = urllib.request.Request(f"{grafana_url}/api/datasources", headers=headers) print("[*] 2. Dang tao NOC Dashboard...") print("[*] 3. Dang tao Telegram Contact Point...") cp_payload = {"name": "Telegram NOC", "type": "telegram", "settings": {"bottoken": BOT_TOKEN, "chatid": CHAT_ID}} print("[*] 4. Dang tao Alert Rule...") alert_payload = { |
Sau đó chạy python3 auto_grafana.py là xong, lỗi gì paste AI check.
5. KIỂM TRA LẠI
Vào các đường link này để xem (với 199.135 là IP server giám sát)
Dashboard vừa tạo bằng code http://192.168.199.135:3000/d/noc-overview
Data Source (Prometheus) http://192.168.199.135:3000/connections/datasources
Alert Rules (Bắn cảnh báo) http://192.168.199.135:3000/alerting/list
Contact Points (Bắn tin Telegram) http://192.168.199.135:3000/alerting/notifications
Trên Router, thử shutdown 1 cổng Gi3:
interface GigabitEthernet3
shutdown
end
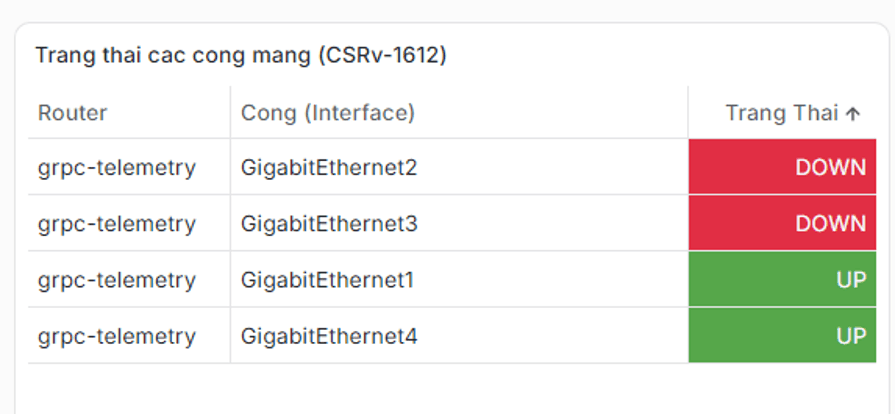
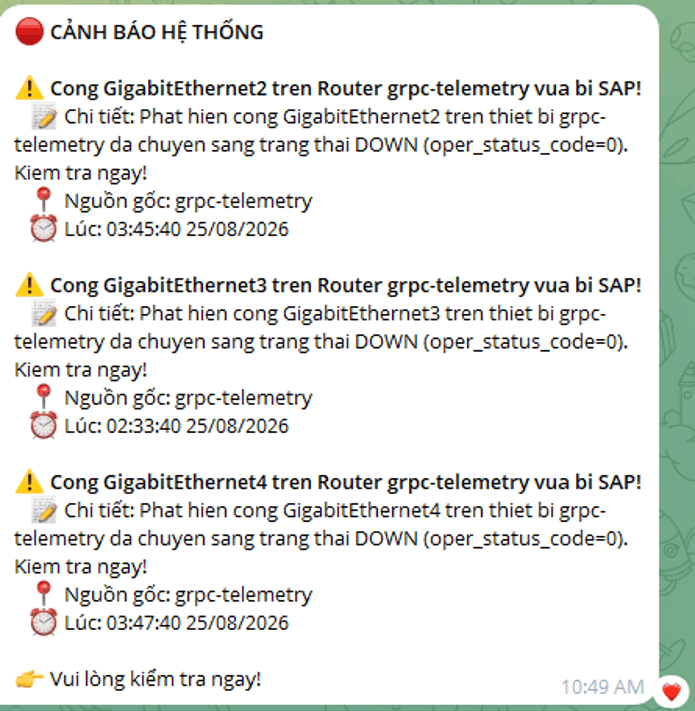
Mở link Dashboard , trong vòng 10 giây, ta thấy:
- Cổng GigabitEthernet3 chuyển sang trạng thái DOWN (Đỏ), nhanh hơn hẳn SNMP:
- Telegram nhận được tin nhắn cảnh báo.
Bài viết cùng danh mục



Danh mục bài viết
- Juniper
- Tài Nguyên LAB
- Wireshark
- FeedBack
- Multicast lab
- Security Infa
- Checkpoint
- Lab OSPF
- Router Logging
- LAB CCNA CCNP CÓ GIẢI
- DMVPN
- Mikrotik
- MPLS
- PFSENSE
- DUMP CCNA
- Điều khoản
- F5 LTM
- MONITOR NETWORK
- TOOL HỌC CCNA
- TƯ VẤN KHÓA HỌC
- PYTHON SCRIPT HỮU ÍCH
- IPv6
- Quality of Service
- QoS
- VXLAN
- SDWAN
- ISE
- Fortigate
- BGP
- MINH HỌA KHÁI NIỆM TRONG CCNA
- Bài tập CCNA CCNP (support Học viên)
- Phỏng vấn IT chứng khoán
- Layer2 CCNA
- Bài tập thiết kế mạng CCNA
- Linux
- EEM SCRIPT
- ASA LAB
- DHCP
- NEXUS
- Giao thức IS IS
- ANSIBLE
- PALO ALTO
- ARUBA SWITCH
- CÂU HỎI TỪ ĐỀ THI THẬT
- Firepower Cisco
- MERAKI CONFIG
- VRF
- AWS SIMULATOR CHO NETWORK ADMIN
- ĐỊNH HƯỚNG NGHỀ NGHIỆP
- Troubleshoot lỗi mạng
- TRẮC NGHIỆM THỰC TẾ
- TÀI NGUYÊN LÀM LAB
- Giải thích lí thuyết dễ hiểu
- TỔNG ĐÀI
- WIFI
- CEH cho network admin
- CCNA HIỆU ỨNG ĐỘNG

![[VIDEO] Cài đặt EVE và fix lỗi](https://hainguyenit.edubit.vn/data/sites/60dd42834108d3de178b4568/files/cai-eve.png)
.png)